Getting What You Pay Taxes for: A Tax-Stack Calculator for Price, Value, and Resilience
Price is what you pay.
Value is what you get.Warren Buffett 2008 Letter to Berkshire Hathaway Shareholders
What do you actually pay for government at a specific address, and what do you get in return? BenchmarkUSA is built to make that answer clearer.
Price is the missing interface in local government
Most people have a rough sense that one place has “high taxes” and another place has “lower taxes.” But that is not the same as knowing the price of government at a real address.
In practice, people face overlapping layers: state, county, city/town/village, school district, and sometimes special districts. The tax burden is fragmented across those layers, and the quality or sustainability of services is even harder to evaluate.
That opacity weakens accountability. When price signals are hard to see, incentives get blurry. Households and businesses cannot easily compare tradeoffs, and governments receive weaker feedback from the people they serve.
“Under competition – and under no other economic order – the price system automatically records all the relevant data. Entrepreneurs, by watching the movement of comparatively few prices, as an engineer watches a few dials, can adjust their activities to those of their fellows.”
Friedrich A. Hayek, The Road to Serfdom (Reader’s Digest condensed edition).
Hayek’s key insight is directly relevant here: prices are a mechanism for communicating dispersed information. In local government, that mechanism is fragmented across institutions and hard for residents to observe.
BenchmarkUSA’s objective is to make those signals legible so incentive loops work better in practice. At a minimum, users should be able to see:
- what they pay
- what layer imposes each component
- whether the system delivering those services appears fiscally resilient
What we are shipping now: Tax-Stack Calculator (work in progress)
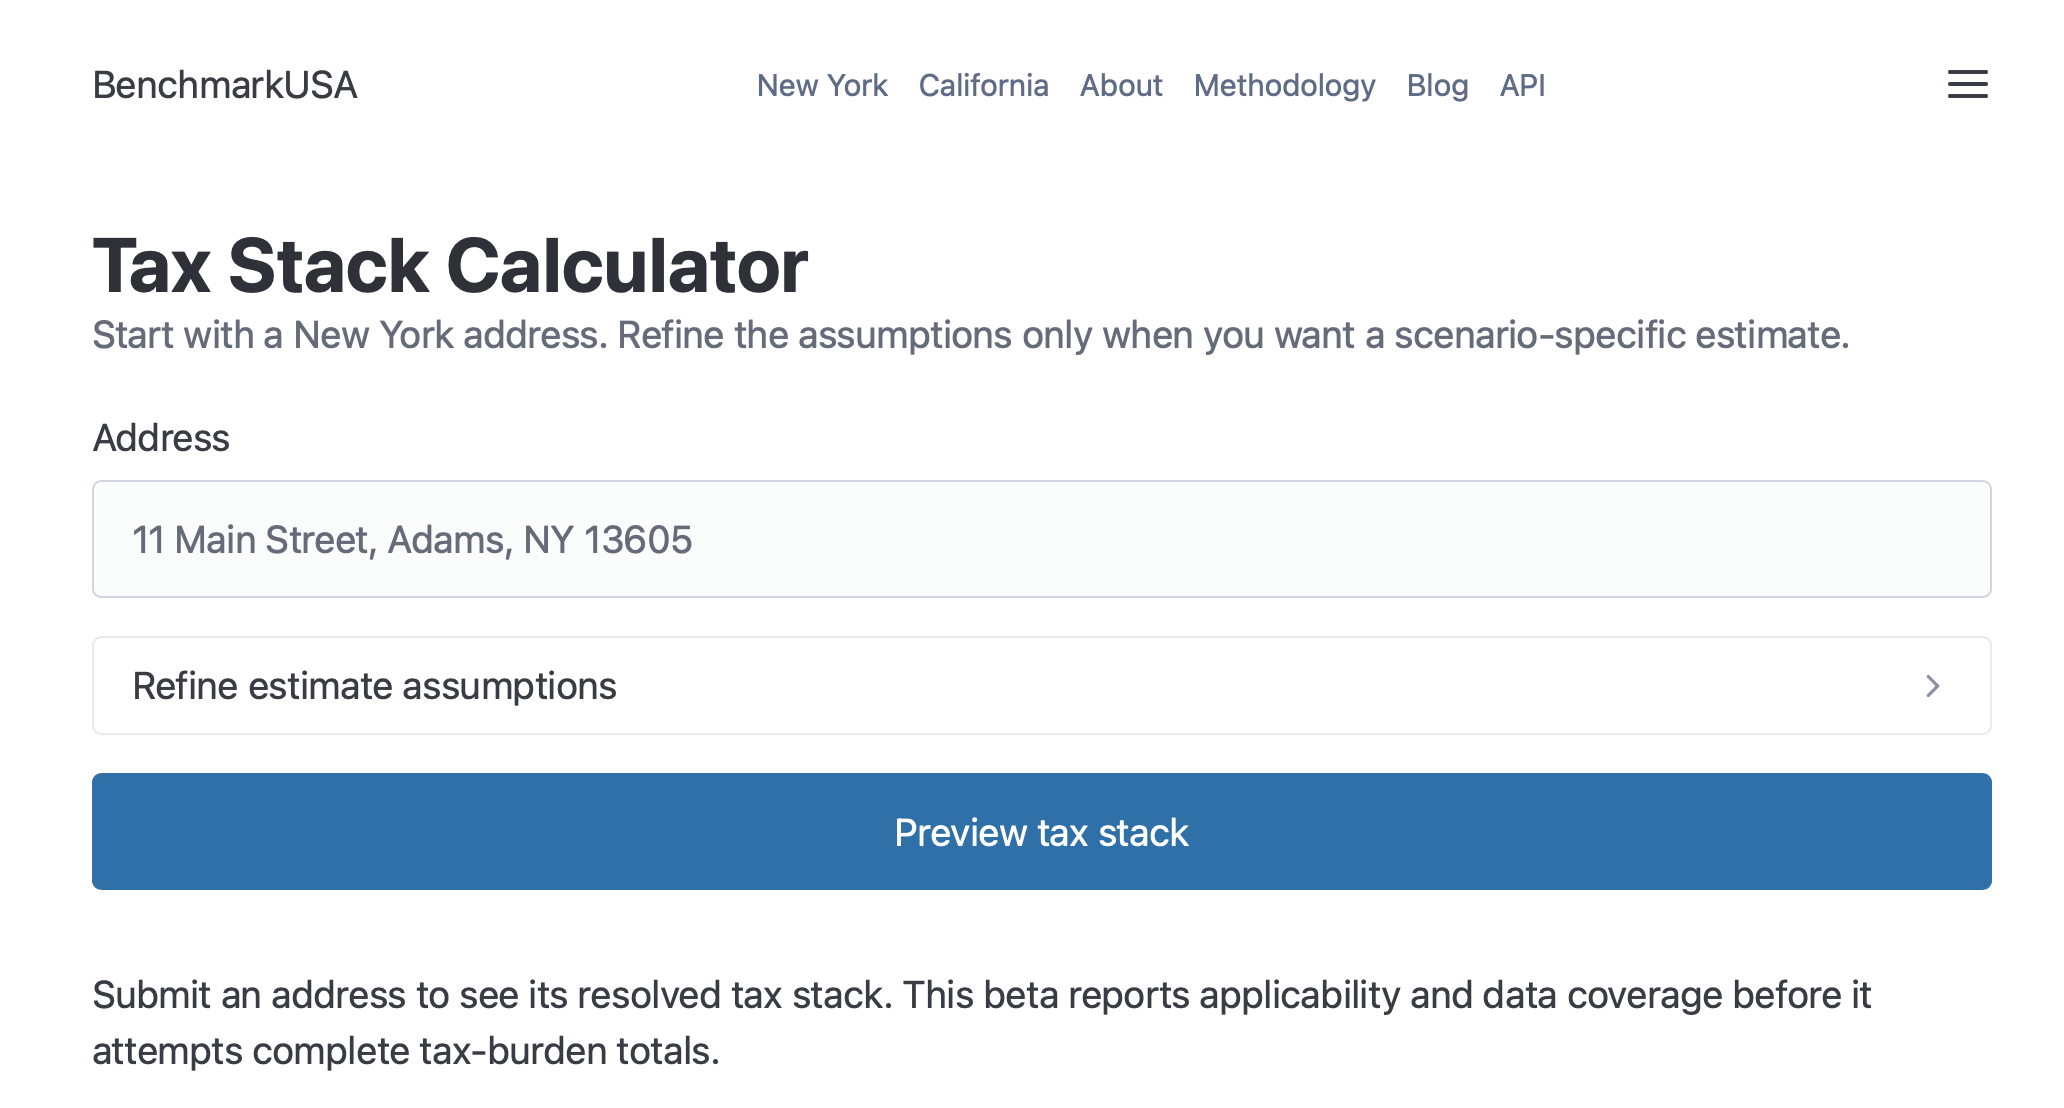
The current implementation is NY-first and address-first.
For a given address, the calculator is being built to show:
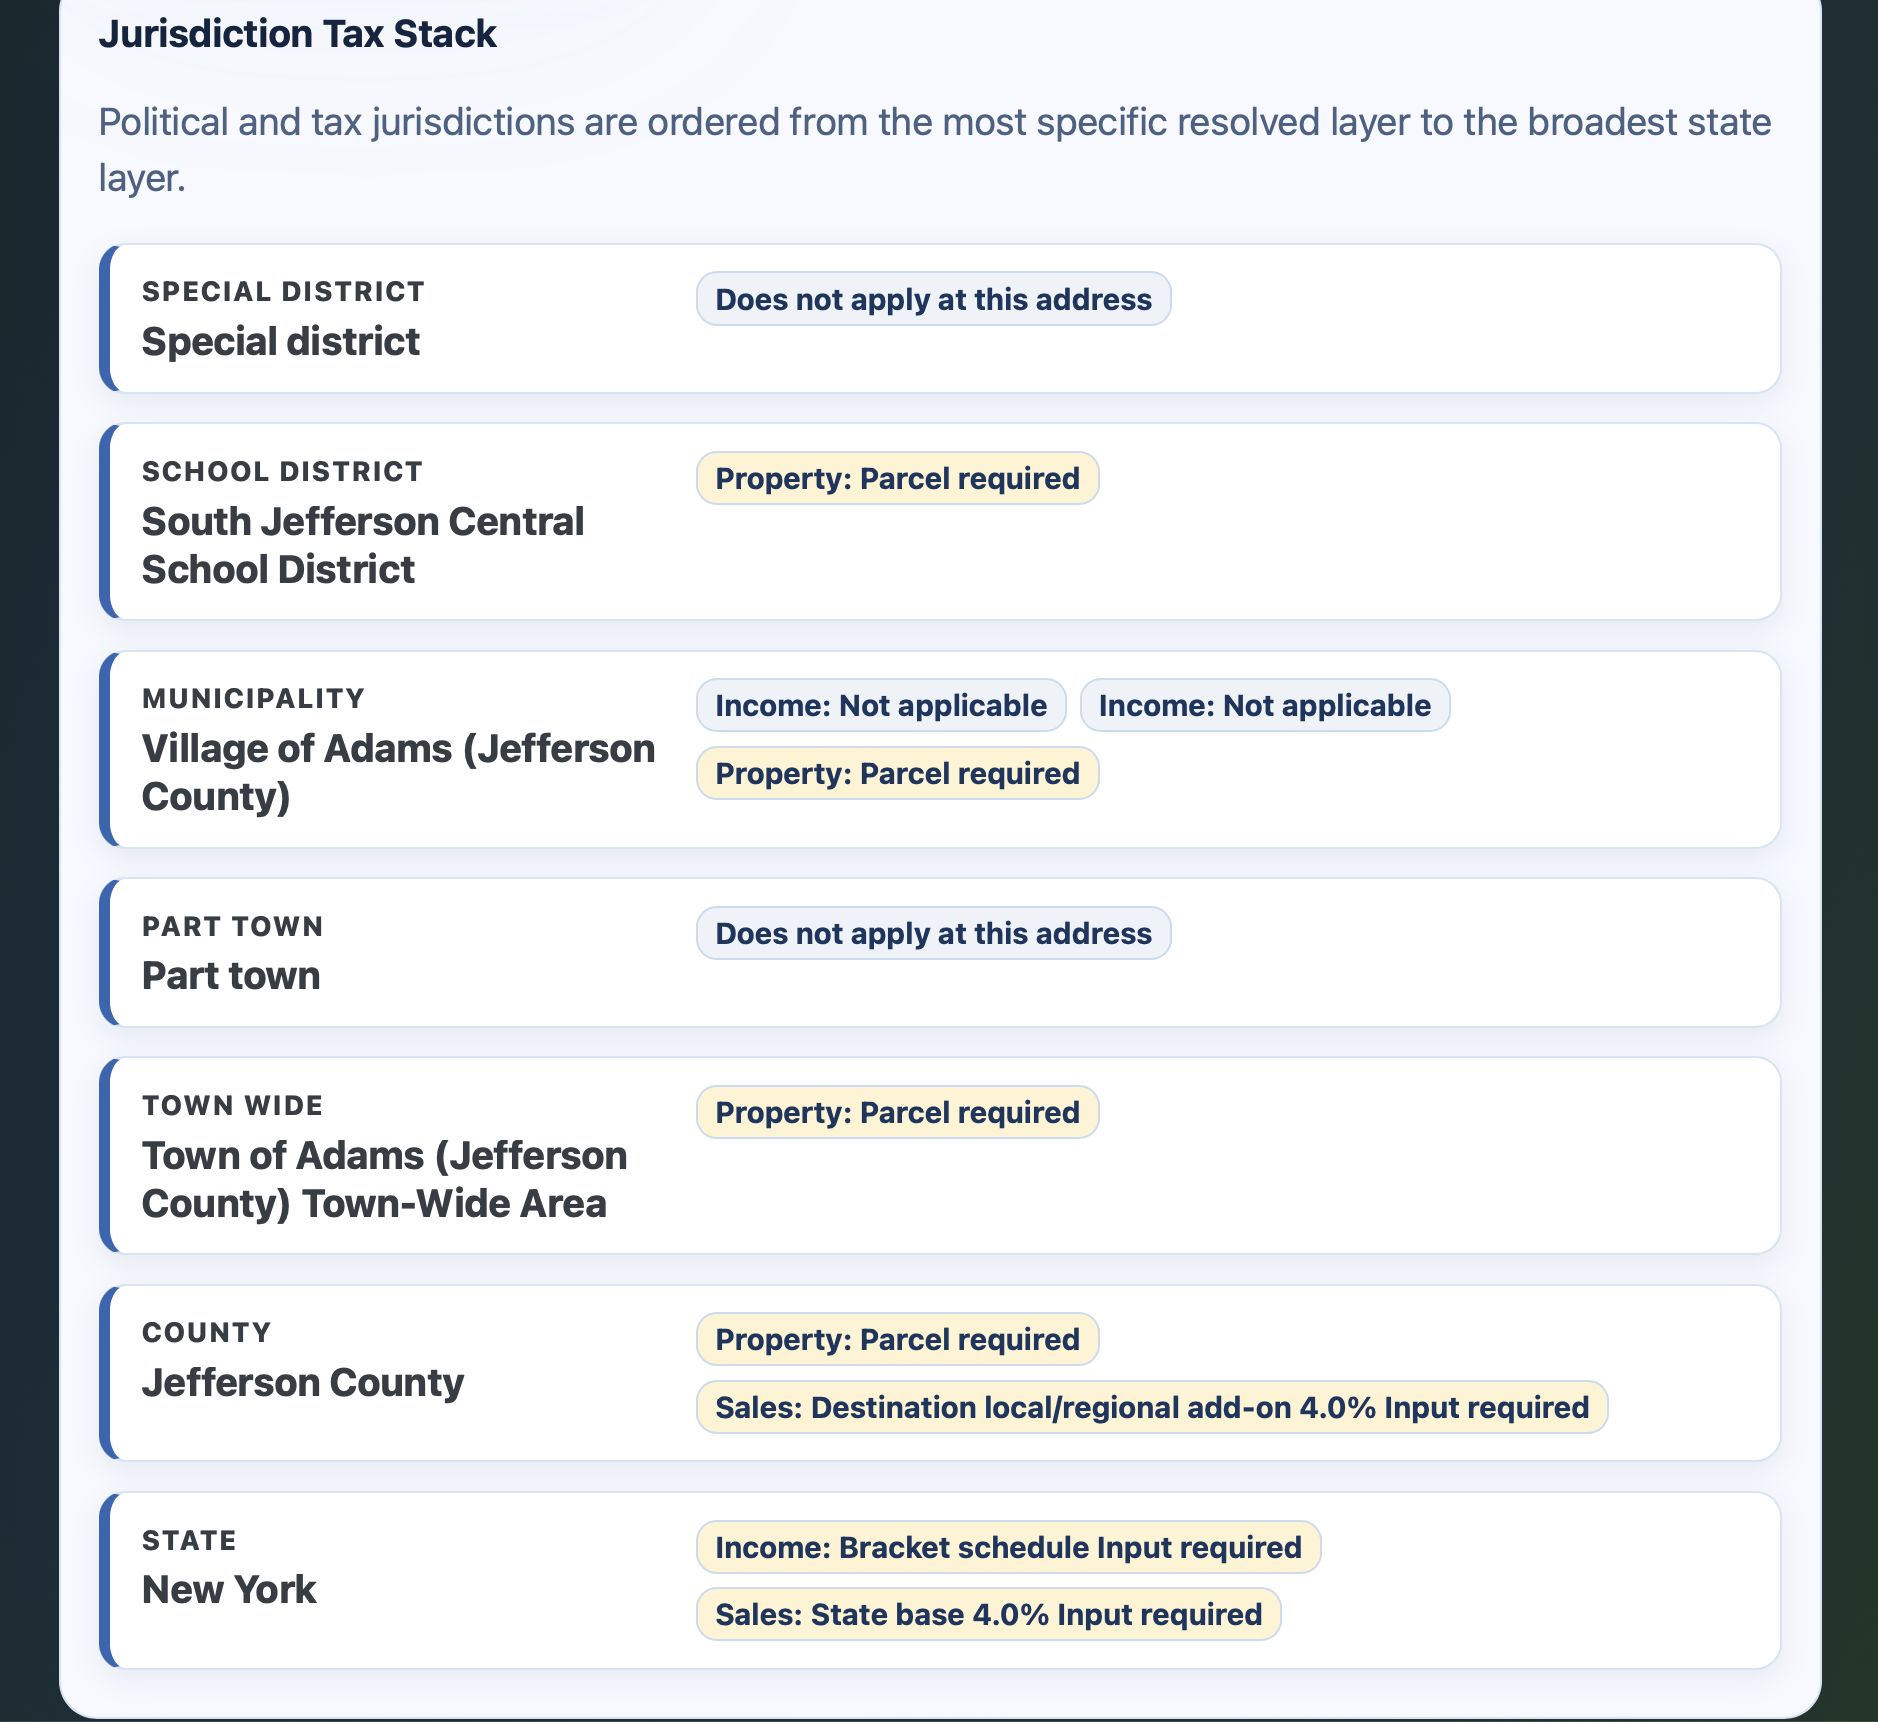
- the jurisdiction stack that applies
- which taxes are source-backed and calculable now
- which components still require more inputs or source coverage
- explicit caveats when data is missing or method paths are still in progress
Current state (April 27, 2026):
- NY state + destination-based local sales-tax stack is loaded from official NY sources
- NY income-tax method routing is implemented in part, with remaining table/worksheet paths explicitly marked rather than hidden
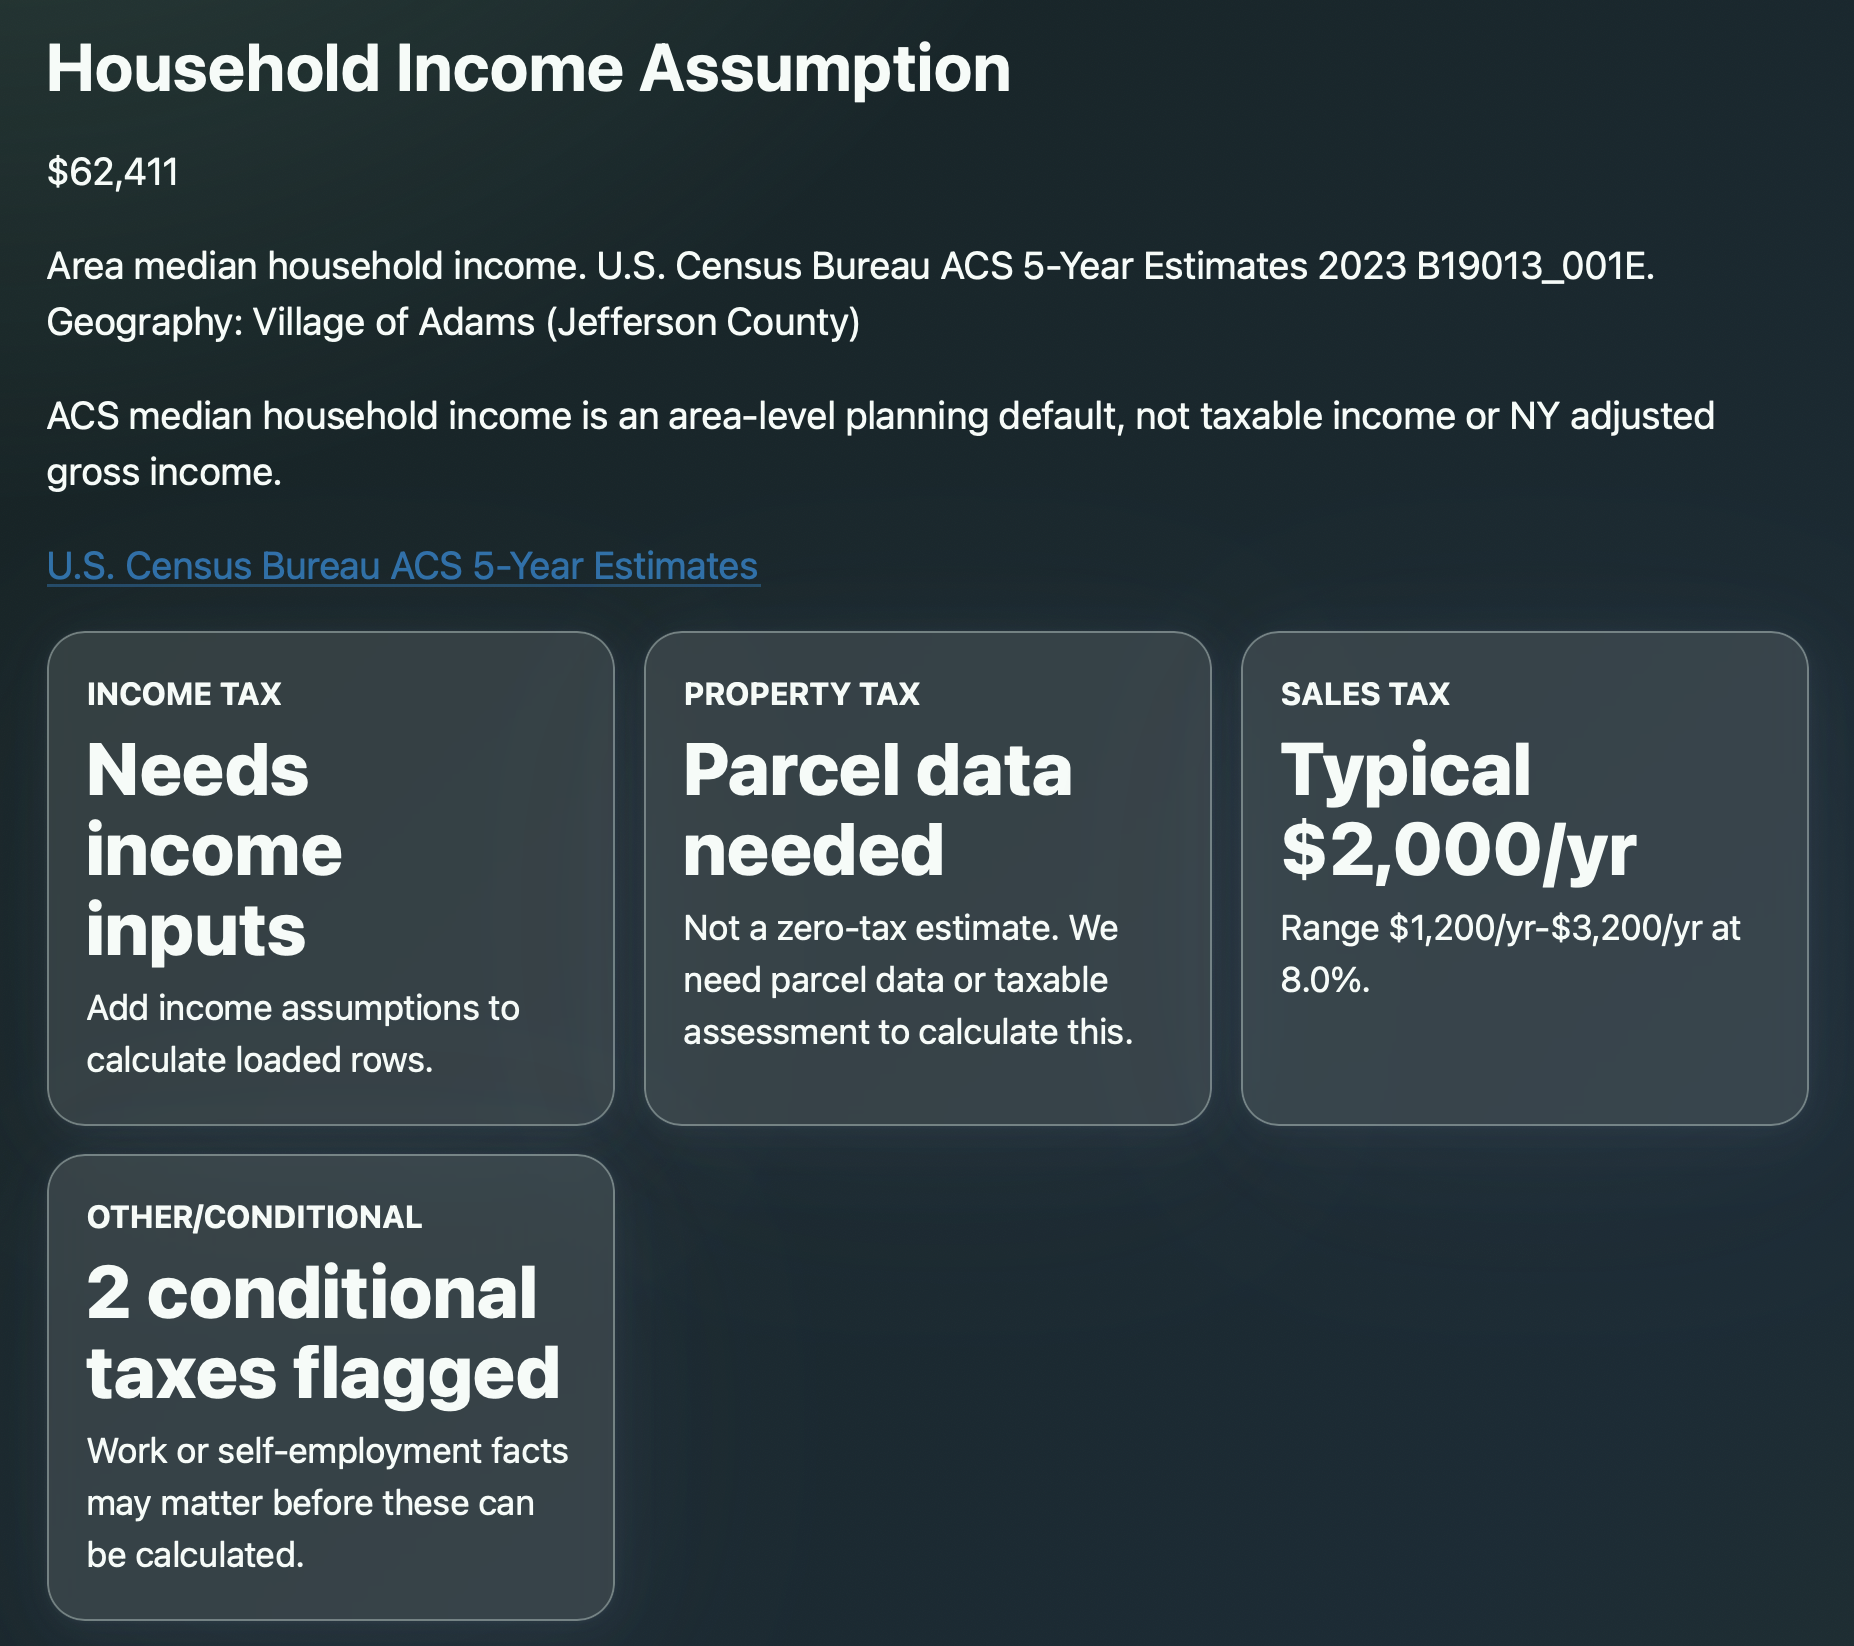
- Household-income assumptions now support a source-labeled ACS/ZCTA default path for estimation scenarios
- The calculator is intentionally transparent about
calculatedvsinput_requiredvsrate_missingstates
Rollout plan over the next week
Near-term rollout is designed so people can test with real addresses immediately:
- finish NY state coverage in the next few days
- expand to VA/DC/MD next so Northern Virginia reviewers can test real addresses
- expand to NJ/CT shortly thereafter
- expand from specific addresses to more general municipalities
Rationale: Ship where users and reviewers can directly pressure-test the product. Get immediate feedback.
Beyond taxes: Fiscal Stress Assessment
Price alone is not enough. Two places can have similar tax levels while carrying very different long-term risks.
BenchmarkUSA already imported and validated New York Fiscal Stress Monitoring System (FSMS) coverage across NY entity types. That NY baseline is the model for building a broader, state-neutral Fiscal Stress Assessment framework for municipal entities across the U.S.
The next model layer needs to combine near-term and long-horizon signals, including:
- reserves/unassigned funds,
- debt-service pressure,
- delayed infrastructure maintenance and deferred capital investment,
- pension and other long-term obligation funding adequacy.
In other words: not only “what do you pay now?” but also “how sustainable is the system you are paying for?”
What users should get from this
For households, employers, site selectors, journalists, and local officials, the intended value is straightforward:
- clearer tax pricing at the address level,
- better comparability across overlapping jurisdictions,
- earlier visibility into fiscal fragility before it turns into service disruption or crisis.
Longer term, the objective is national coverage: an address-level tax-stack calculator and fiscal resilience grader for all U.S. addresses and political entities.
If you want to follow progress or share feedback, reach out at [email protected].