Six New York local governments climbed out of “Significant Fiscal Stress” in the NYS Comptroller’s Fiscal Stress Monitoring System and now carry no fiscal stress designation. These aren’t just numbers on a chart — they translate directly into lower borrowing costs, better services, and more resilient communities.
Why fiscal health matters to residents
When a local government’s fiscal stress score drops, real things happen:
Lower borrowing costs. Bond ratings rise, interest rates fall. Rockland County went from one notch above junk to Moody’s AAA — the difference between paying millions more in interest and having that money available for roads, parks, and services. Monroe County’s seven rating upgrades since 2021 mean every future capital project costs taxpayers less.
More room to invest. A government under fiscal stress is deciding which services to cut. A government in good fiscal health can make strategic investments — addressing environmental challenges, upgrading infrastructure, absorbing economic shocks. Fund balance isn’t money sitting idle; it’s the difference between reacting to crises and preventing them. The OSC’s own research on fiscal stress drivers shows how depleted reserves cascade into service cuts and deferred maintenance.
Tax relief becomes possible. Monroe County’s property tax rate is now the lowest since 1947. Rockland County proposed zero tax increase for 2026. Fiscal discipline doesn’t just stabilize budgets — it creates room to lower the burden on residents.
Accountability to the state. The OSC’s FSMS isn’t just a report card. For Nassau County, fiscal stress triggered a state control board (NIFA) with authority to reject budgets and impose its own. Getting out of stress means regaining local control over local decisions.
The turnarounds
Rockland County — From worst to first
Population: ~339,000. Peak stress: 87 (2012–2013). Current: 3.3 (2024).
In 2014, Rockland County had a $240 million debt load, a $138 million deficit, and the title of New York State’s most fiscally stressed county. Its credit rating was one notch above junk.
Under County Executive Ed Day, the county embarked on what became one of the most dramatic fiscal recoveries in state history. Budgeting practices were overhauled, reserves rebuilt, and the county’s $96 million deficit bond was paid off in 2024. Rockland is now the only New York county with a Moody’s AAA bond rating — their highest possible rating. From worst to first.
The FSMS data shows the trajectory clearly: 87 in 2012, 64 in 2017, 26 in 2019, 7 in 2021, 0 by 2022.
View Rockland County’s stress trajectory →
Monroe County — Seven rating upgrades in five years
Population: ~754,000 (home to Rochester). Peak stress: 82 (2012–2015). Current: 15.8 (2024).
Monroe County carried “Significant Fiscal Stress” for eight consecutive years (2012–2017). A 2018 state audit revealed the county was on the brink of insolvency, resorting to short-term borrowing to cover cash deficits, with fund balance at just 0.1% of total spending.
The turnaround under County Executive Adam Bello has been methodical: conservative budgeting, growing reserves, and a property tax rate now at its lowest since 1947. The county has received seven credit rating increases since 2021 and is now rated AA by all three major agencies — the first time since 2001.
Environmental stress has remained low throughout (under 17), suggesting the county’s problems were financial management rather than structural economic decline. That makes the recovery more notable — it was largely within the county’s control.
View Monroe County’s stress trajectory →
Niagara Falls — Recovery despite the odds
Population: ~48,000. Peak stress: 77.1 (2017). Current: 0.0 (2024).
Niagara Falls was designated “Significant Fiscal Stress” for five consecutive years (2017–2020), driven partly by a dispute between New York State and the Seneca Nation over casino revenue sharing. The city relied heavily on gaming revenue — $140 million since 2013 — and was exposed when payments stopped.
The recovery involved improved budgeting practices and reduced reliance on casino revenue. Fund balance grew from $1.1 million in 2021 to $21.3 million by 2024 — four consecutive years of operating surpluses. S&P raised the city’s bond rating from BBB+ to A- with a “positive” outlook.
What makes Niagara Falls remarkable is the environmental context. Environmental stress has held steady around 40 throughout the period — population decline, poverty, aging infrastructure. The city got its fiscal house in order despite persistent structural challenges, not because those challenges went away.
View Niagara Falls’ stress trajectory →
Nassau County — Fiscal improvement under state oversight
Population: ~1.4 million (Long Island). Peak stress: 73 (2014). Current: 3.3 (2024).
Nassau County’s fiscal story is complicated by NIFA — the Nassau Interim Finance Authority, a state control board created in 2000 with authority to monitor and, when necessary, override county financial decisions. Nassau was designated “Significant Fiscal Stress” by the OSC in 2014, 2017, and 2018.
The improvement since then has been real: scores dropped from 73 to 3.3, and the county has carried “No Designation” since 2022. But the story isn’t entirely one of local initiative — NIFA sent Nassau’s 2025 budget back for revision in late 2024, citing the use of prior-year surpluses to fund future expenses in violation of GAAP.
For a county of 1.4 million people, the second most populous in the state outside NYC, the tension between local governance and state oversight is itself a story worth following.
View Nassau County’s stress trajectory →
Town of Oyster Bay — Post-scandal recovery
Population: ~301,000. Peak stress: 76.7 (2017). Current: 0.0 (2024).
Oyster Bay’s fiscal stress is inseparable from its governance history. Former Town Supervisor John Venditto pleaded guilty to corruption charges in 2019 after a federal investigation revealed hidden side deals that exposed the town to over $20 million in concealed liabilities. The SEC charged both the town and Venditto with defrauding municipal bond investors. The town’s credit rating, once AAA, was slashed to BB+ — junk status, the only locality in New York to hold that distinction.
Under new leadership, the town eliminated its deficit and paid down $150 million in capital debt. Three consecutive years of zero fiscal stress (2022–2024) and zero environmental stress tell a recovery story, but also a cautionary tale about the fiscal damage that corruption inflicts on communities.
View Town of Oyster Bay’s stress trajectory →
Yonkers — The big city that turned around
Population: ~210,000 (4th largest city in New York). Peak stress: 67.5 (2020). Current: 5.0 (2024).
Yonkers oscillated between “Susceptible” and “Significant” for years, receiving a “Significant Fiscal Stress” designation in 2020 at 67.5. The reversal was sharp: 31 in 2021, 5 in 2022, 2 in 2023. Environmental stress dropped in parallel, from 37 to 13.
As the largest city on this list and the fourth largest in the state, Yonkers demonstrates that fiscal turnarounds aren’t limited to small jurisdictions with simple budgets. However, a 2024 OSC budget review noted the city’s reliance on $133.5 million in nonrecurring revenue — a reminder that sustained fiscal health requires ongoing discipline, not one-time fixes.
View Yonkers’ stress trajectory →
What these stories share
Turnarounds take 4–7 years. None happened overnight. Most involved consistent improvement over five or more budget cycles.
Environmental stress is stickier than fiscal stress. Niagara Falls brought fiscal stress to zero while environmental stress stayed at 40. You can fix your budget; you can’t quickly fix population decline or poverty rates. But being fiscally healthy gives you more options to address those structural problems.
The bond market rewards discipline. Rockland went from near-junk to AAA. Monroe got seven upgrades. Niagara Falls moved from BBB+ to A-. Every upgrade means lower interest rates on future borrowing — real money that can go to services instead of debt payments.
Fiscal stress is largely within local control. Monroe County’s low environmental stress during its fiscal crisis shows the problem — and the solution — was financial management. Oyster Bay’s corruption-driven collapse shows how governance failures create fiscal crises independent of economic conditions.
If you’re a local official, journalist, or researcher — or a resident who wants to understand your community’s fiscal trajectory — I’d love to hear from you at contact@nybenchmark.org.
All fiscal and environmental stress scores are from the NYS Comptroller’s Fiscal Stress Monitoring System. Population figures are from the U.S. Census Bureau American Community Survey. Pre-2017 FSMS scores have been normalized to the 100-point scale for trend consistency. Bond rating information is sourced from official county/city press releases and reporting by the Bond Buyer, WGRZ, Long Island Press, and Mid Hudson News.
]]>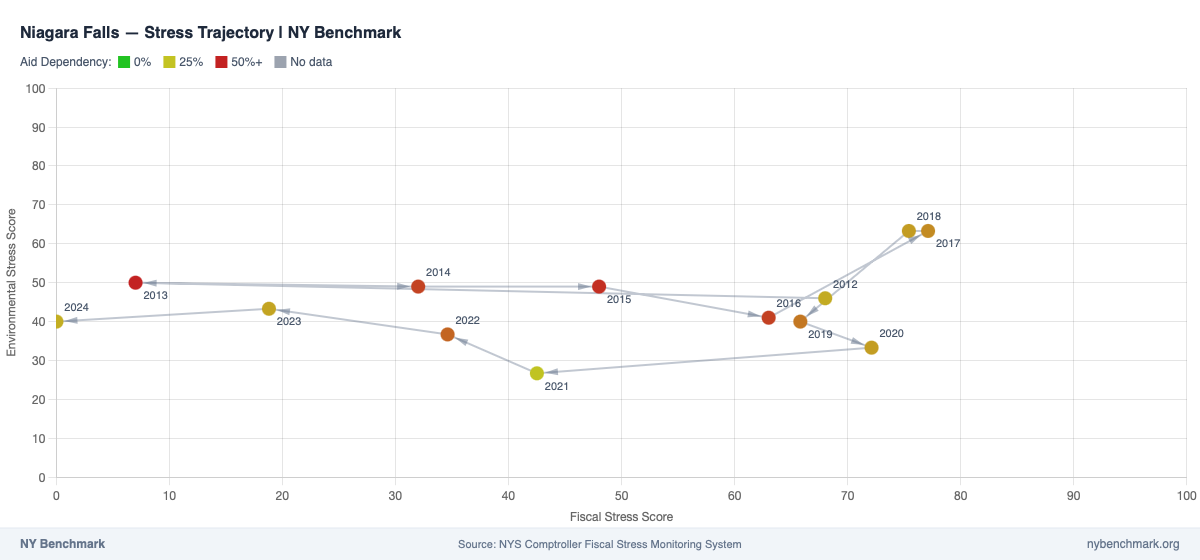 Niagara Falls went from “Significant Fiscal Stress” (score ~75) in 2012 to near zero by 2024 — a textbook turnaround.