Same New York, But Better
Categories:project
Topics:benchmarkingcivic-reformtransparencyoscmunicipal-financenew-york
New York is a place of extraordinary ambition, talent, and cultural vitality. It attracts people from around the world and inspires deep loyalty from those who call it home. Yet when it comes to the everyday functioning of government— at all levels —New York too often tolerates outcomes that fall well short of what its residents should reasonably expect.
This project starts from a simple contention:
Government at the local, county, and state level can be more effective, more efficient, and more affordable if it is more transparent and if we systematically compare outcomes across jurisdictions.
The New York Benchmarking Project exists to make that comparison possible.
Why Benchmarking?
Benchmarking is the practice of comparing organizations performing similar functions in order to identify best practices, outliers, and inefficiencies. It is routine in private industry, medicine, logistics, and engineering. It is far less routine in local government, where fragmentation, nonstandard reporting, and political incentives often obscure comparison.
Yet New York and states around the country contain a natural laboratory. Here we’ve got:
- 62 cities, ranging from very small to very large
- 62 counties (a numerical coincidence, not a structural symmetry)
- Hundreds of towns, villages, and special districts
- Largely shared legal frameworks
- Common state oversight and reporting requirements
If one city delivers public services at lower cost with equal or better outcomes, that fact should be visible. If another city spends far more for worse results, that too should be visible.
Benchmarking does not dictate policy. It creates the conditions for informed judgment.
The Problem: Transparency but Fragmentation
New York and our Office of the State Comptroller is actually a national leader in collecting and disseminating municipal financial data: Much of the data is available but it’s not standardized or designed to compare one jurisdiction with another. The OSC also doesn’t provide demographic information like population, education, median home values and crime rates. Those details come from other databases like the US Census office and the Department of Justice.
As a result, even engaged citizens, journalists, and policymakers struggle to answer basic questions such as:
- How much does this city spend per resident on core services?
- How do employee compensation and benefits compare to peer cities?
- Are debt levels and long-term liabilities out of line with similar communities?
Voice, Exit, and Decline
When local governance performs poorly, residents have three broad responses: Exit, Voice, and Loyalty.
New York has increasingly seen the former.
Since the early 20th century, New York’s share of the national population has declined relative to other states. This shift is reflected in the state’s representation in the U.S. House of Representatives, which has steadily decreased as population growth has moved elsewhere (see Figures 1 and 2). While many factors contribute to this trend, governance quality and cost of living influence whether people choose to stay, invest, and raise families.
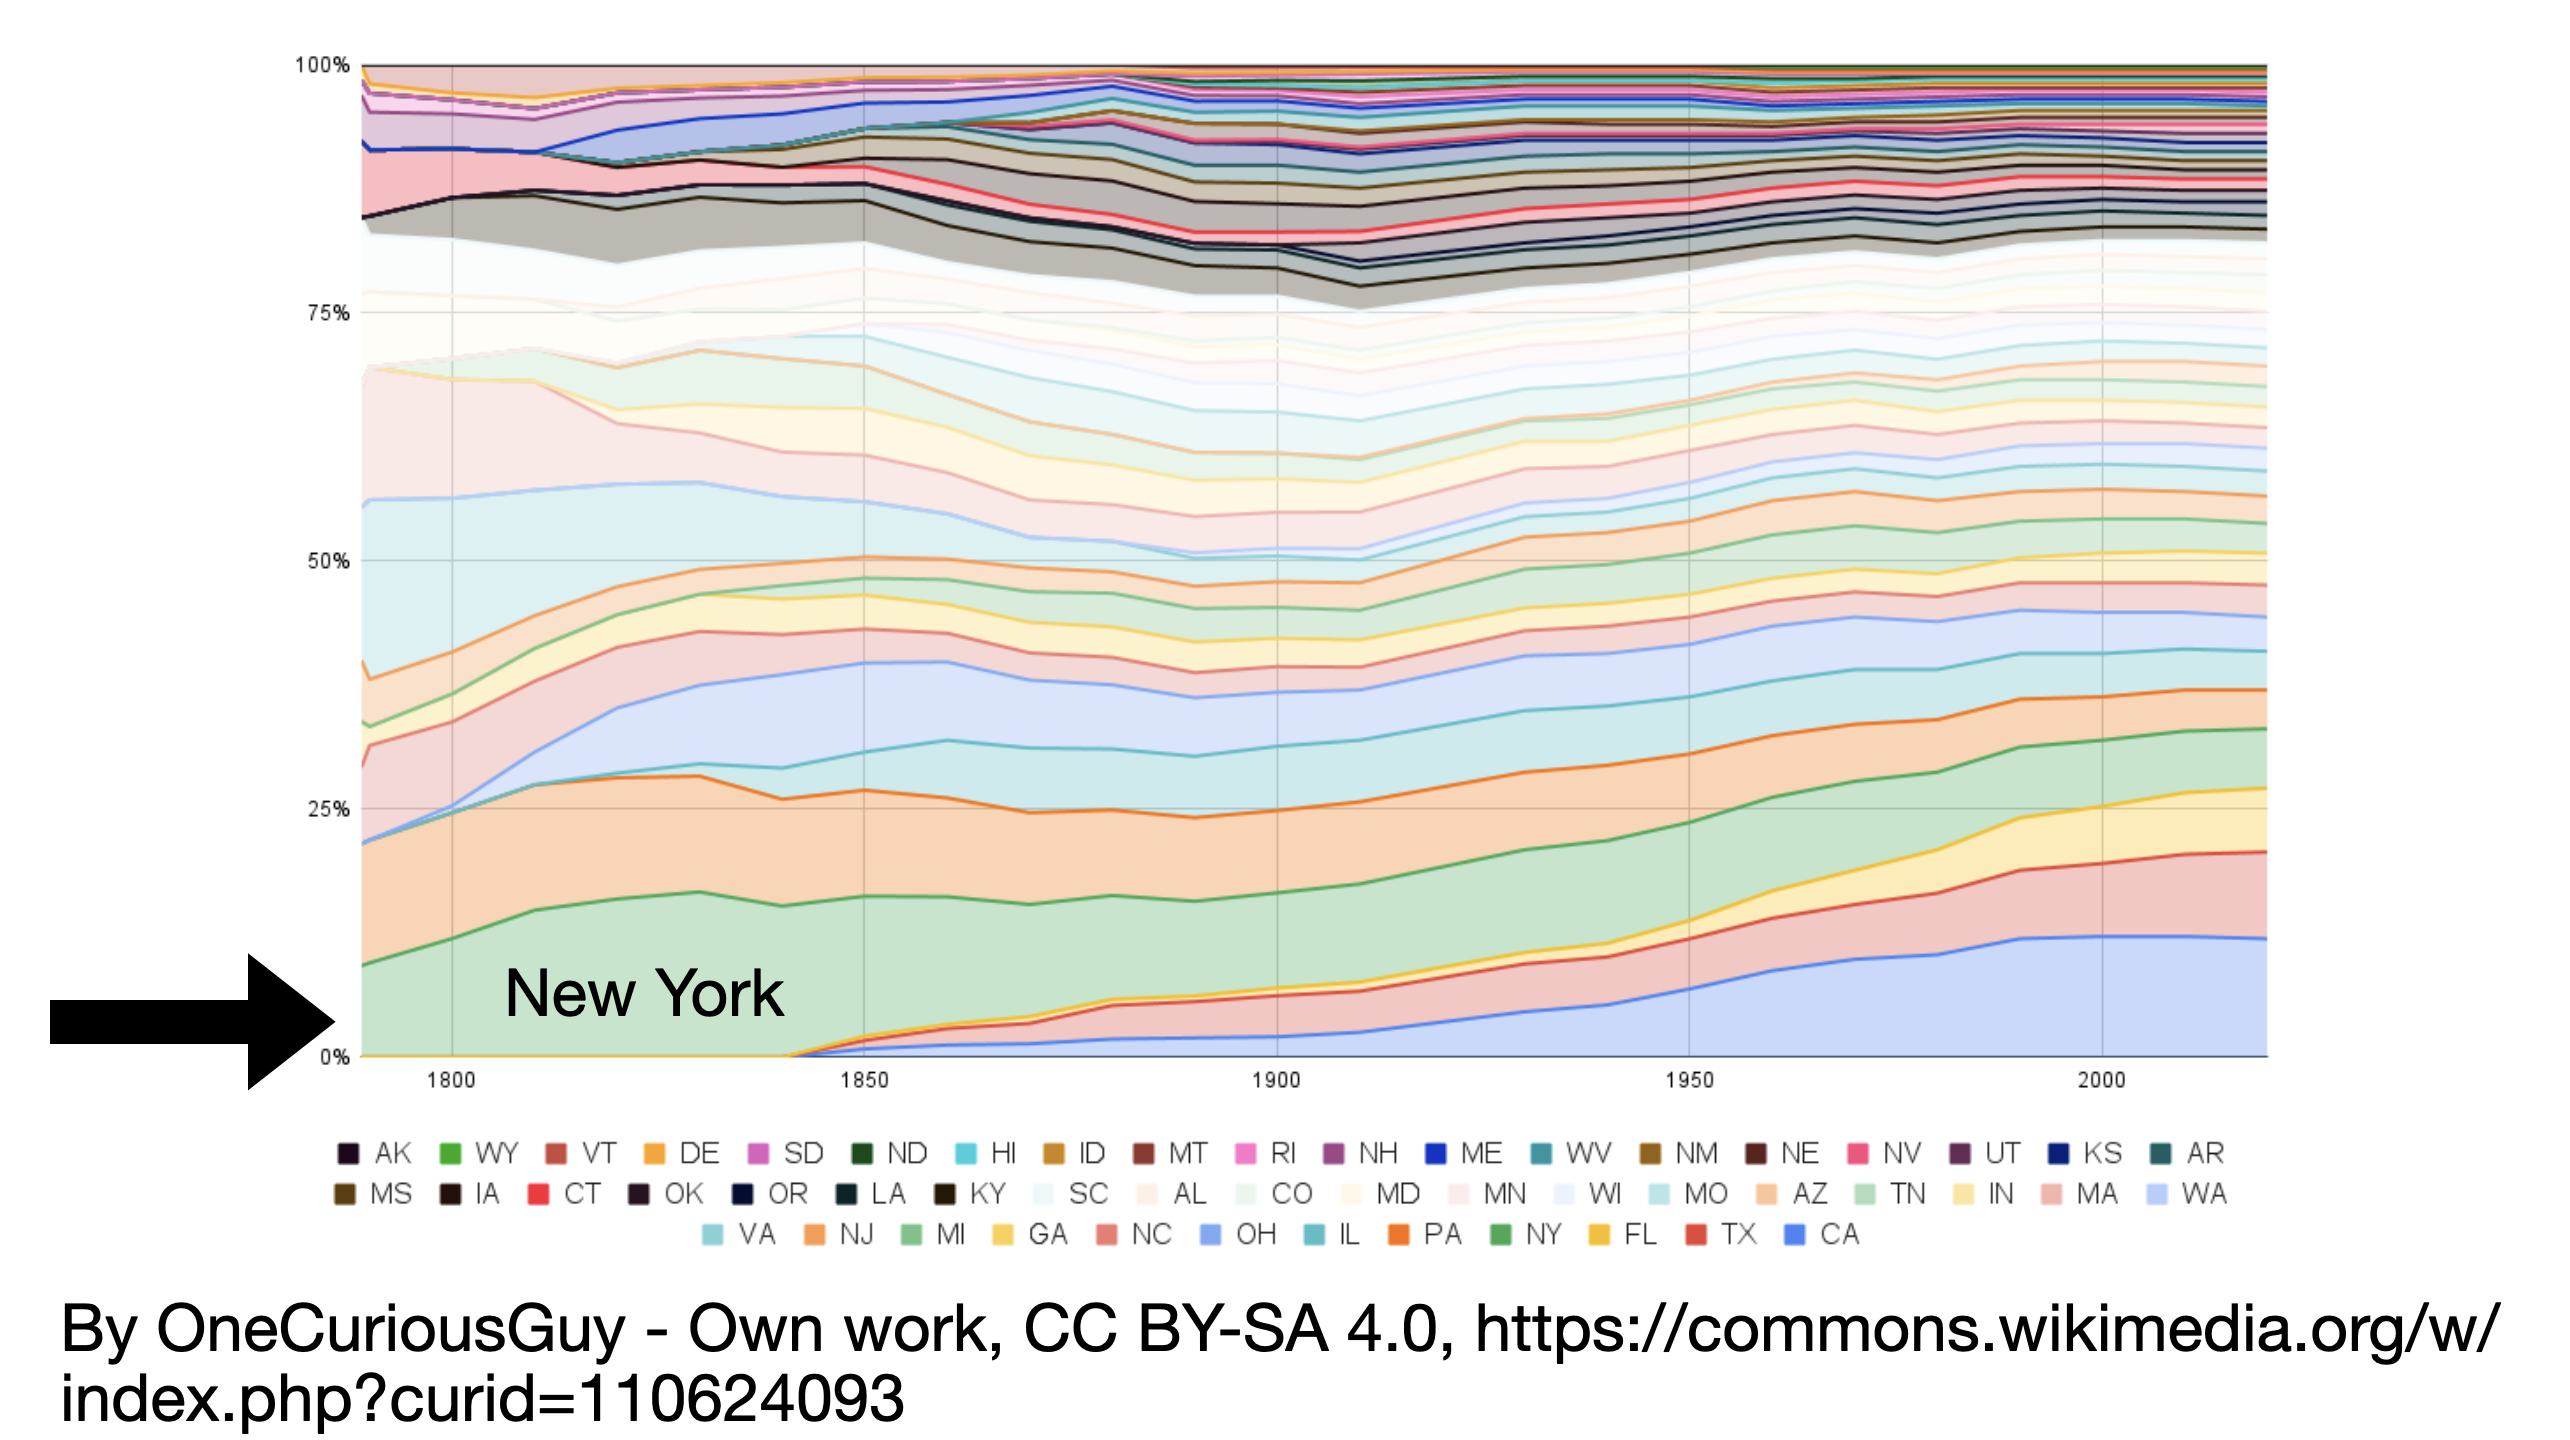
Figure 1. New York’s share of seats in the U.S. House of Representatives relative to other states, illustrating a long-term decline in national representation.
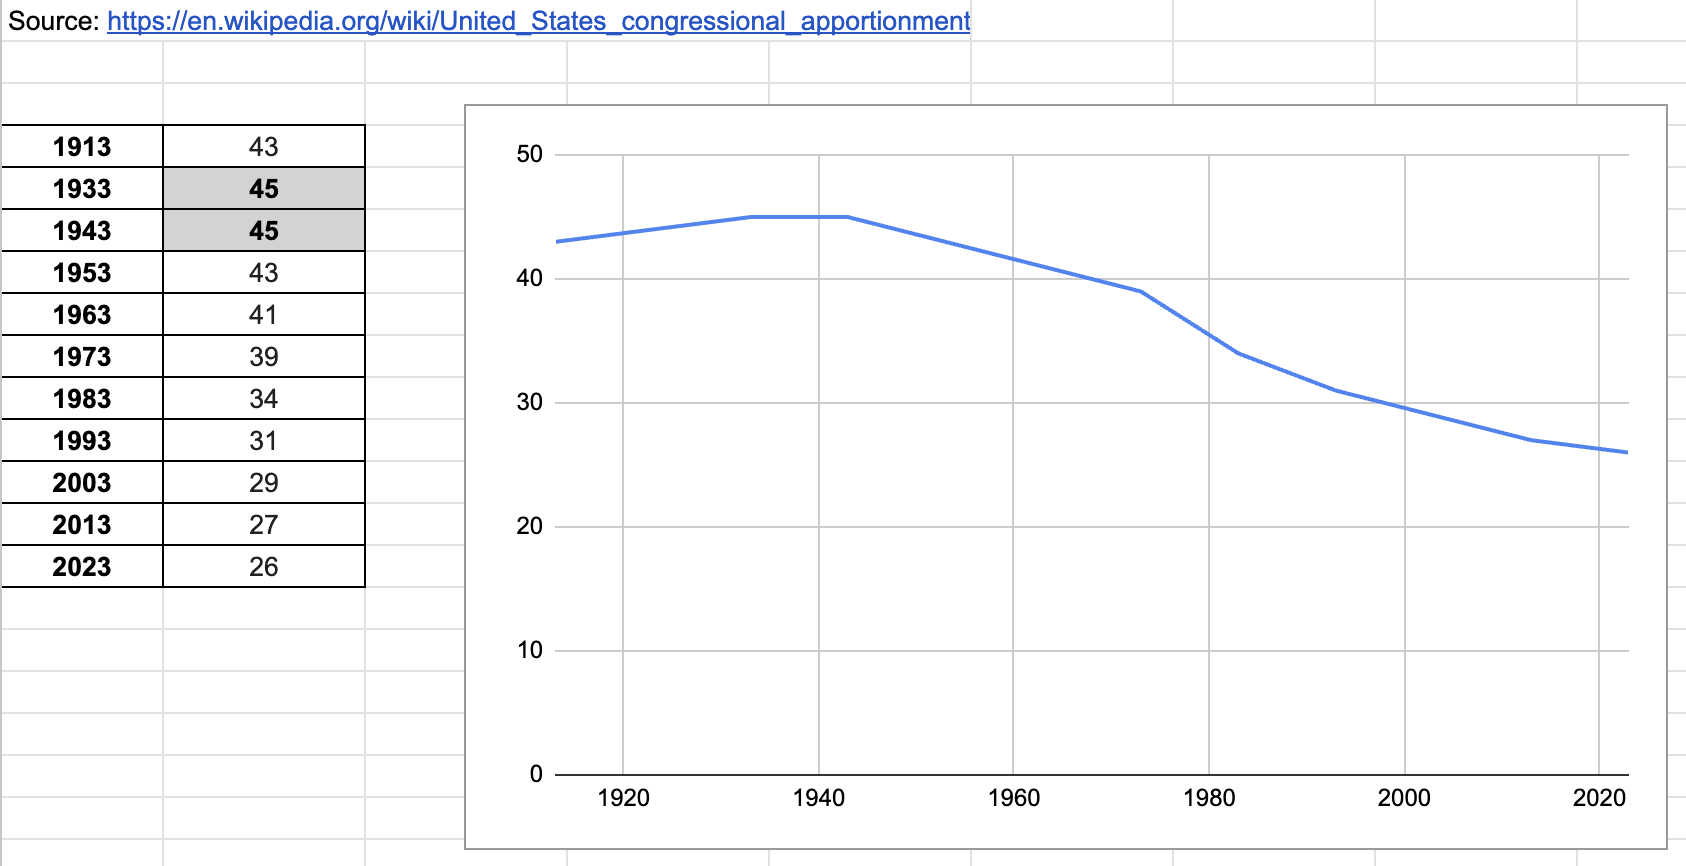
Figure 2. Absolute number of U.S. House seats held by New York since the House was standardized at 435 members.
This project is premised on a belief that decline is not inevitable. Better information enables better choices—and better governance.
What This Project Will Do
The New York Benchmarking Project aims to:
- Collect and document financial and governance data starting with the 62 cities in New York State and moving on to its counties, towns, villages, districts, and authorities.
- Publish comparable metrics that allow meaningful benchmarking across jurisdictions.
- Explain methods and assumptions transparently, so conclusions can be challenged and improved.
- Support civic education, public discussion, and evidence-based reform.
All work is intended to be transparent and verifiable. All claims are intended to be traceable.
What This Project Will Not Do
- Advocate for a specific political party or ideology
- Replace democratic decision-making
- Reduce complex policy choices to a single metric
Data informs judgment; it does not substitute for it.
Where This Is Going
This site will publish:
- Essays explaining the motivation and methodology
- Notes on data sources and limitations
- Early findings and comparisons as they emerge
A public data explorer is in development and will be made available as the dataset matures.
The work will be slow, careful, and incremental by design.
New York deserves government that works as well as its people do. Benchmarking is one step toward that goal.