BenchmarkUSA Blog
Civic reform through benchmarking.
BenchmarkUSA tracks local government finance across the United States. We now have Census data for municipalities nationwide, detailed financial data for New York, California, Florida, and North Carolina, and additional state pipelines expanding over time. The goal is simple: make it easier for residents, journalists, researchers, and public officials to compare how local governments raise and spend public money.
New York-only for now. Interactive charts tracking fiscal and environmental stress trajectories across New York cities, counties, towns, villages, and school districts.
BenchmarkUSA now extends beyond New York, with detailed financial coverage already live for California and additional state imports underway.
Query the full dataset from Claude, ChatGPT, Cursor, or any MCP client. Domain-aware caveats included automatically.
Search cities, counties, towns, villages, and school districts with public finance and demographic context.
New York-only for now. Use comparison tools and scatter plots to benchmark New York school districts and counties on spending, aid, and structure.
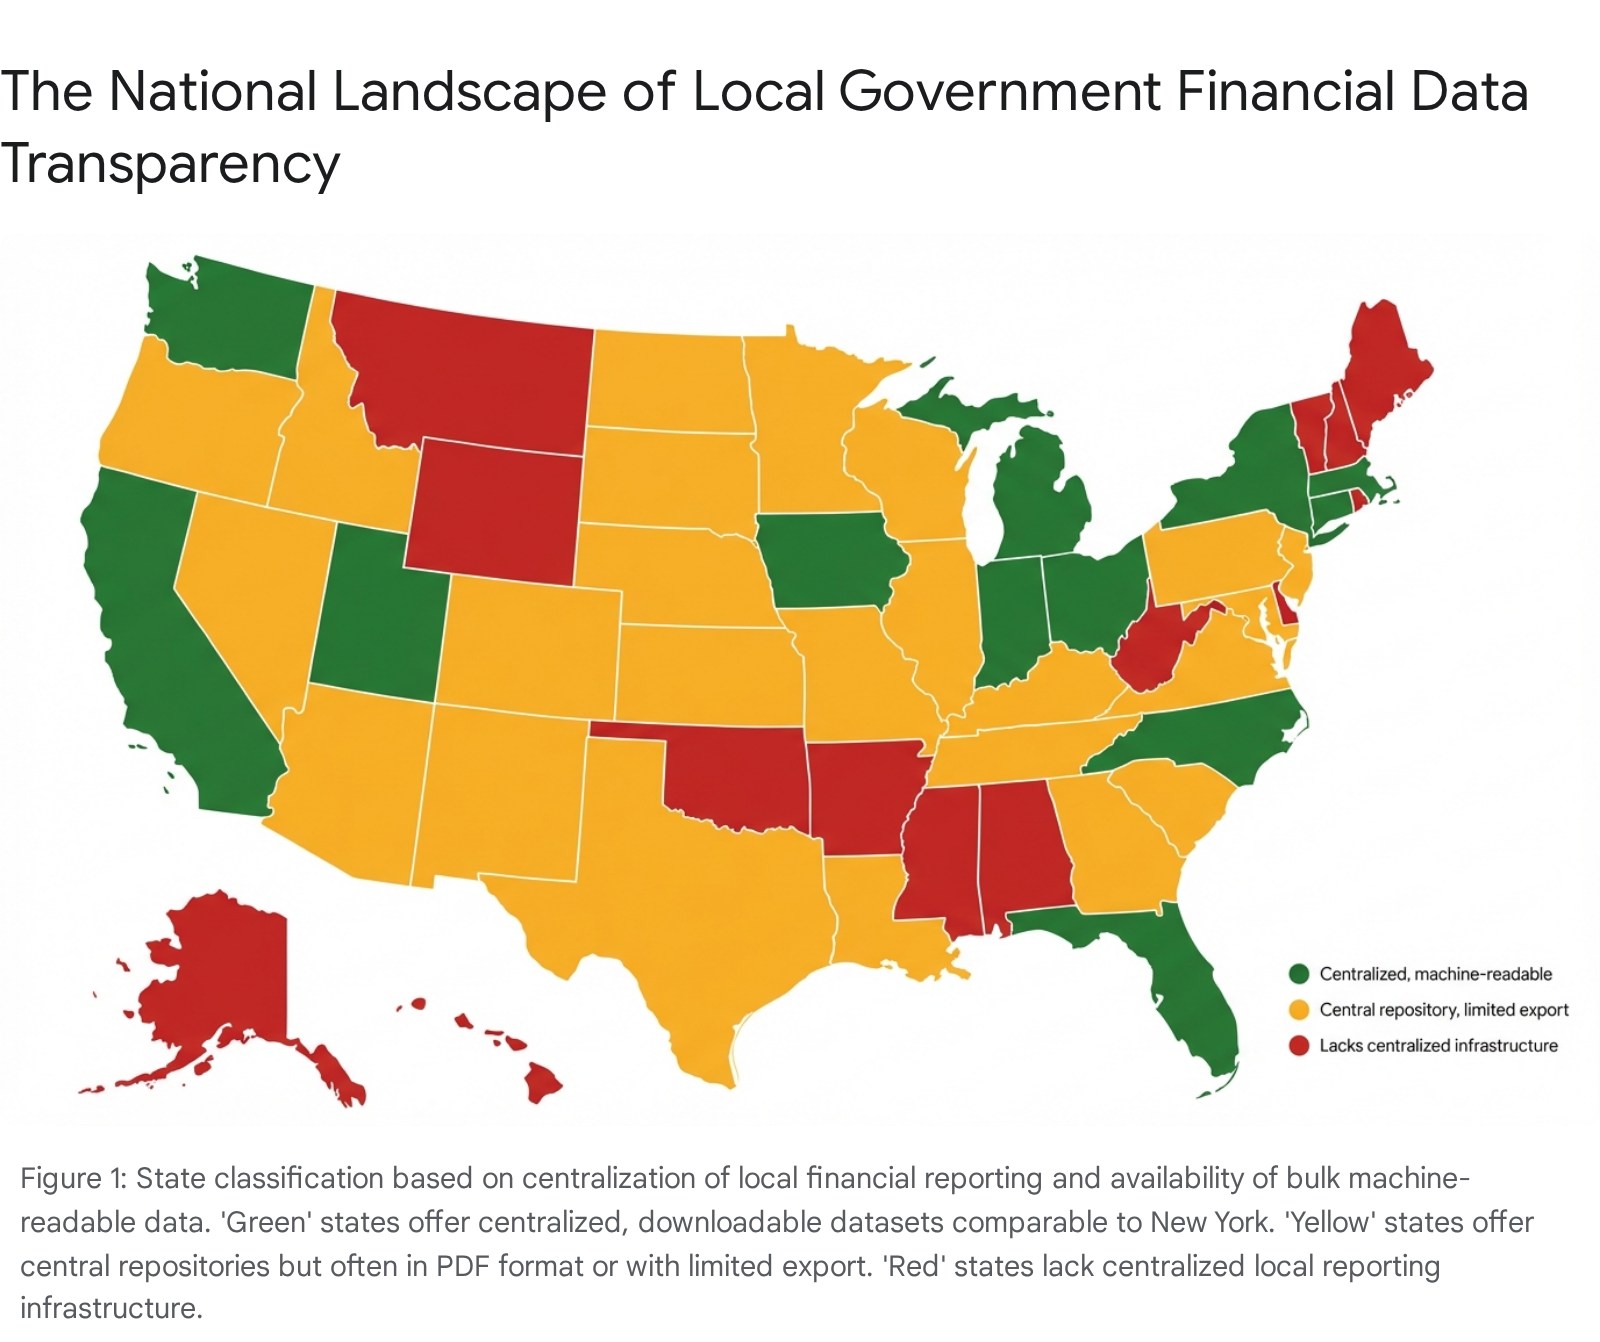
BenchmarkUSA combines nationwide Census data with state and local financial reporting systems. Current sources include the NYS Office of the State Comptroller, the NYC Comptroller, the California State Controller, the Florida Department of Financial Services, North Carolina local government financial reporting, the U.S. Census Bureau, and the OSC Fiscal Stress Monitoring System. BenchmarkUSA normalizes those sources into comparable dashboards, rankings, and time series, and makes the dataset available to AI tools via MCP.
Coming next: broader state coverage, more side-by-side comparisons, richer metric leaderboards, and deeper documentation on methodology and data quality across states.
Posts
subscribe via RSS